Every trend has a shelf life. Trust does not.
A consumer perception study conducted on one of the most talked about brands in America, at the height of its cultural moment.
Survey questions were designed by the course professor. Data was collected through individual consumer interviews conducted by the class and pooled into a shared dataset. Analysis was completed independently in JASP following instruction, with all interpretations and strategic recommendations being original work.
OVERVIEW
RECOMMENDATION 03
The Ask: Find out what actually drives Stanley consumer trust and satisfaction when you strip away the trend and ask people directly.
The Problem: Stanley went from must-have to marked-down. The trend died, the reputation took hits, and consumers moved on without realizing the brand had grown well beyond the cup that made it famous.
Client/Brand Background: Stanley is a drinkware brand founded in 1913. Originally built for workers and outdoor enthusiasts, it became a cultural phenomenon in the early 2020s through TikTok virality, celebrity partnerships, and limited edition drops. By 2023 the brand had grown from $73 million to over $750 million in annual revenue.
The Insight: Consumers valued convenience, durability, and daily reliability far more than trend appeal or sustainability claims.
The Opportunity: Shift Stanley's messaging toward everyday performance and introduce consumers to a product lineup that has outgrown its most famous cup.
The Solution: Five layers of statistical analysis on primary consumer data revealing the real drivers of Stanley brand trust, satisfaction, and purchase preference, with direct advertising strategy recommendations.
Related Work: Reliability testing, Pearson correlation, network analysis, exploratory factor analysis, linear regression, logistic regression, secondary brand research, and advertising strategy.
Conclusion: The data did not confirm what most people assumed about Stanley. It revealed something more useful.
Stanley 1913 is one of the most recognized drinkware brands in the world. This study examined what consumers actually believe about it.
Founded in 1913 by inventor William Stanley Jr., the brand spent over a century serving workers and outdoor enthusiasts before an unexpected pivot turned it into a pop culture phenomenon. The introduction of the Quencher tumbler, amplified by a women-run shopping blog called The Buy Guide and TikTok creators, sent annual revenue from $73 million in 2019 to over $750 million by 2023.
But viral success created a real research problem. If hype was what brought consumers in, what was actually keeping them? What do people believe about the brand when you strip away the celebrity partnerships and the limited color drops and ask them directly? And what do those beliefs mean for how Stanley should advertise going forward?
This study was conducted as part of a consumer research methods course at Appalachian State University. The class interviewed real Stanley consumers and pooled responses into a shared dataset. That dataset was then analyzed independently using JASP statistical software across five statistical methods: reliability testing, Pearson correlation analysis, network analysis, exploratory factor analysis, and linear and logistic regression. Secondary research on Stanley's brand history, advertising campaigns, consumer reviews, and recent controversies was conducted alongside the quantitative work to provide market context.
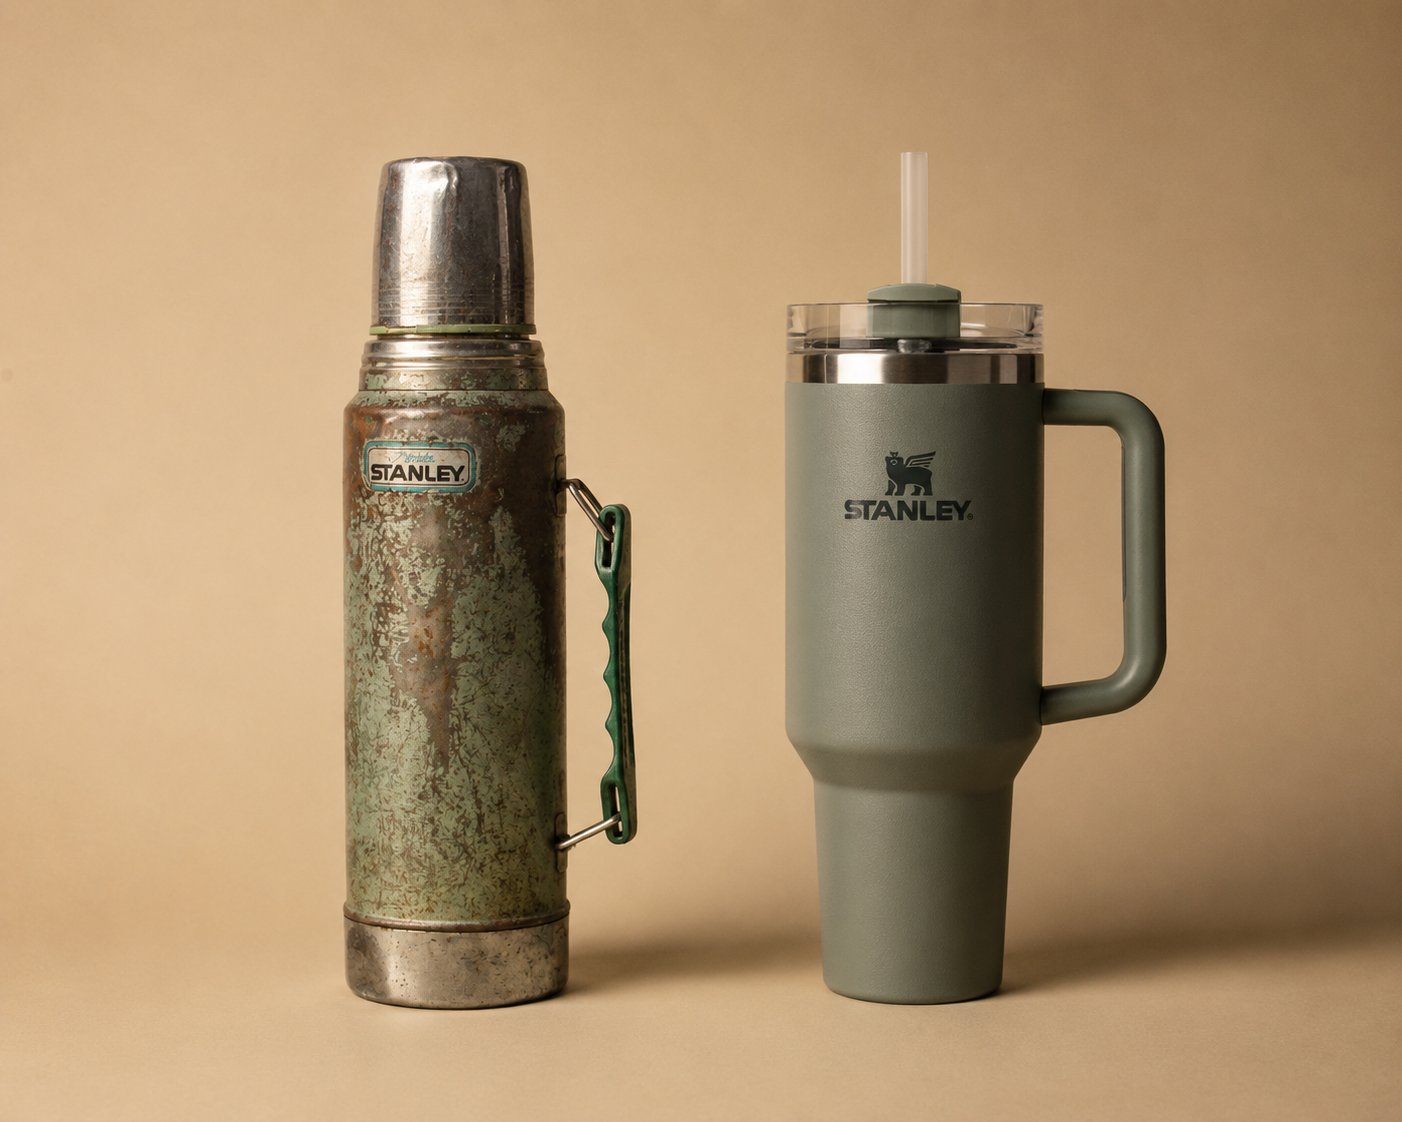
Stanley went from a niche outdoor brand to a billion dollar cultural phenomenon in under five years. Then just as fast, the hype began to fade.
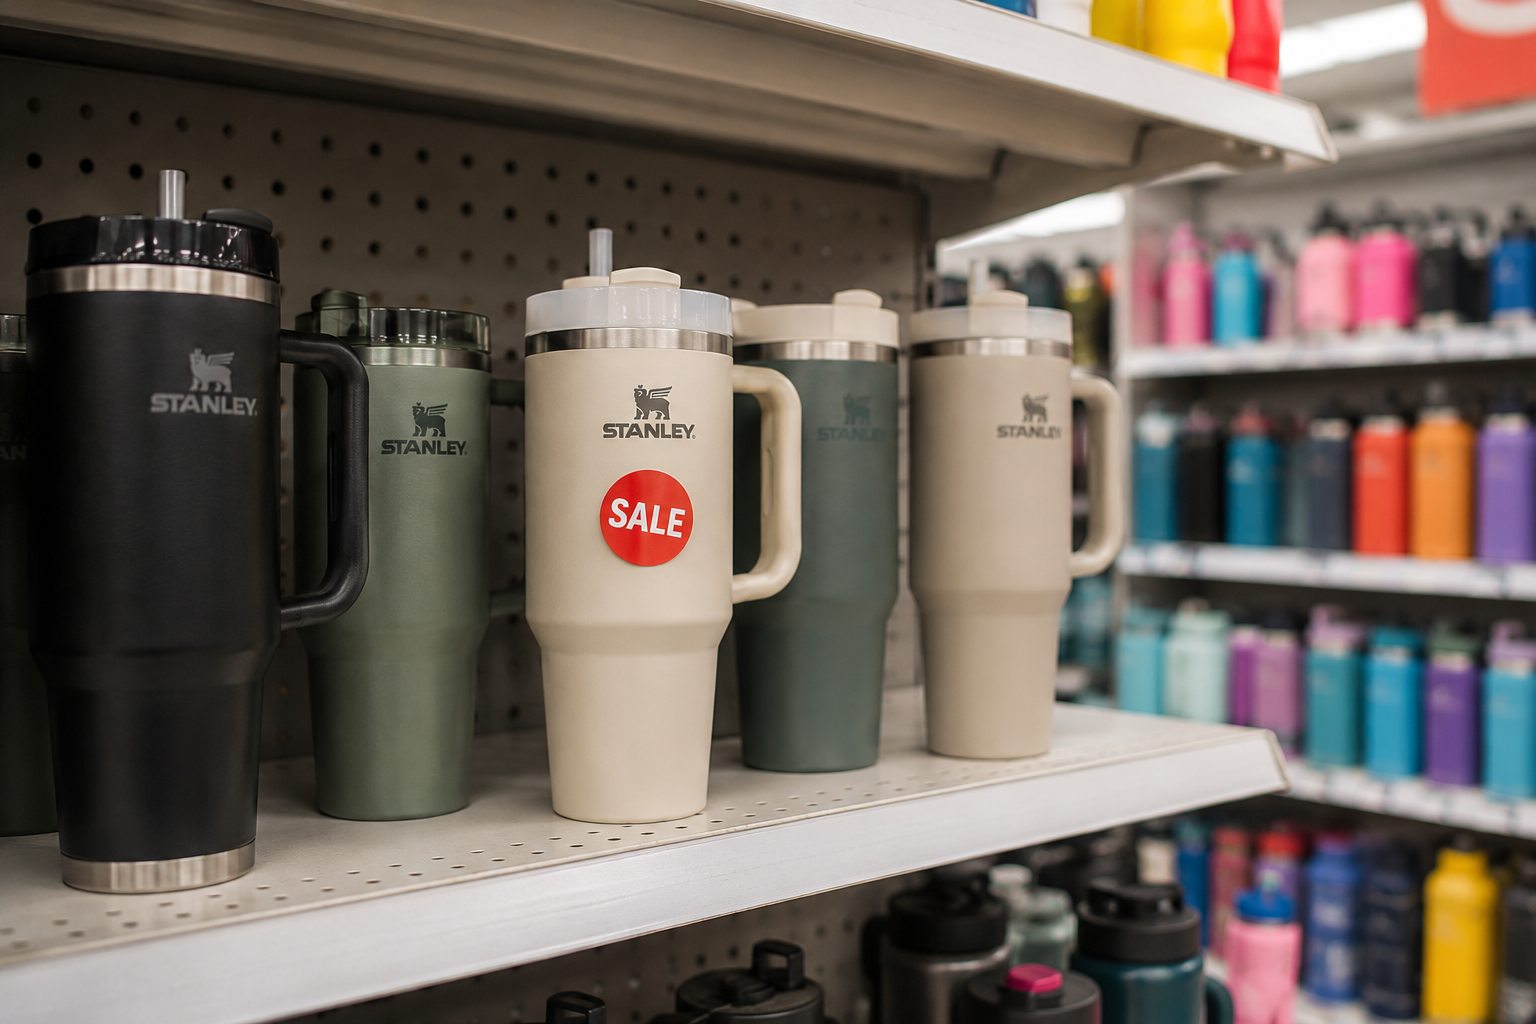
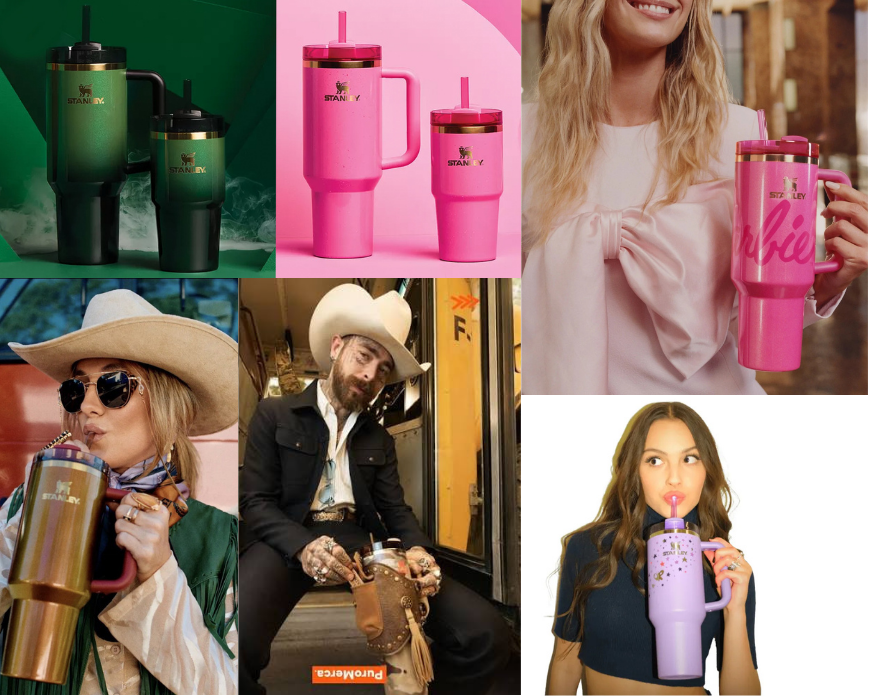
Stanley's rise was driven almost entirely by social media and influencer culture. TikTok creators turned the Quencher into a status symbol. Limited edition drops with celebrities like Olivia Rodrigo and Lainey Wilson sold out within minutes. Consumers fought over Barbie and Wicked collaboration tumblers in Target aisles. The brand became a collector's item as much as a drinkware product.
But by 2024 the picture had shifted. Search interest for Stanley products declined from their peak. Competitors like Owala gained ground by solving daily usability problems that Stanley's open straw design created, including a leak-proof lid and lighter weight construction. A lead controversy spread across social media despite limited evidence of real risk. Stanley products began appearing in discount sections of major retailers.
Meanwhile Stanley expanded its product lineup well beyond the Quencher, introducing shaker bottles, wellness collections, flasks, coolers, and carry accessories. Most consumers do not know these products exist. The brand's social channels are still largely selling the same tumbler identity that peaked in 2022.
THE PROBLEM
Stanley built a cultural phenomenon on hype. Consumer satisfaction was built on something else entirely.
By the time this study was conducted, Stanley had become one of the most talked about brands in America. Celebrity collaborations, limited edition drops, and TikTok virality had driven revenue from $73 million to $750 million in four years. But none of that answered the real question. When you strip away the trend and ask consumers directly what they actually value about the brand, what do they say? And does it match how Stanley is marketing itself?
The class interviewed real Stanley consumers and contributed responses to a shared dataset. That dataset was analyzed independently using five statistical methods.
02 — PEARSON CORRELATION ANALYSIS
THE RESEARCH
THE MARKET
The survey measured 12 independent attributes on a five point Likert scale: quality, durability, appealing design, functionality, environmental friendliness, innovation, trust in the brand, temperature hold, value for price, customer service, ease of cleaning, and convenience to carry. Two dependent variables were also measured: overall satisfaction rated on the same scale, and whether the consumer considered Stanley the best product choice, measured as a yes or no response.
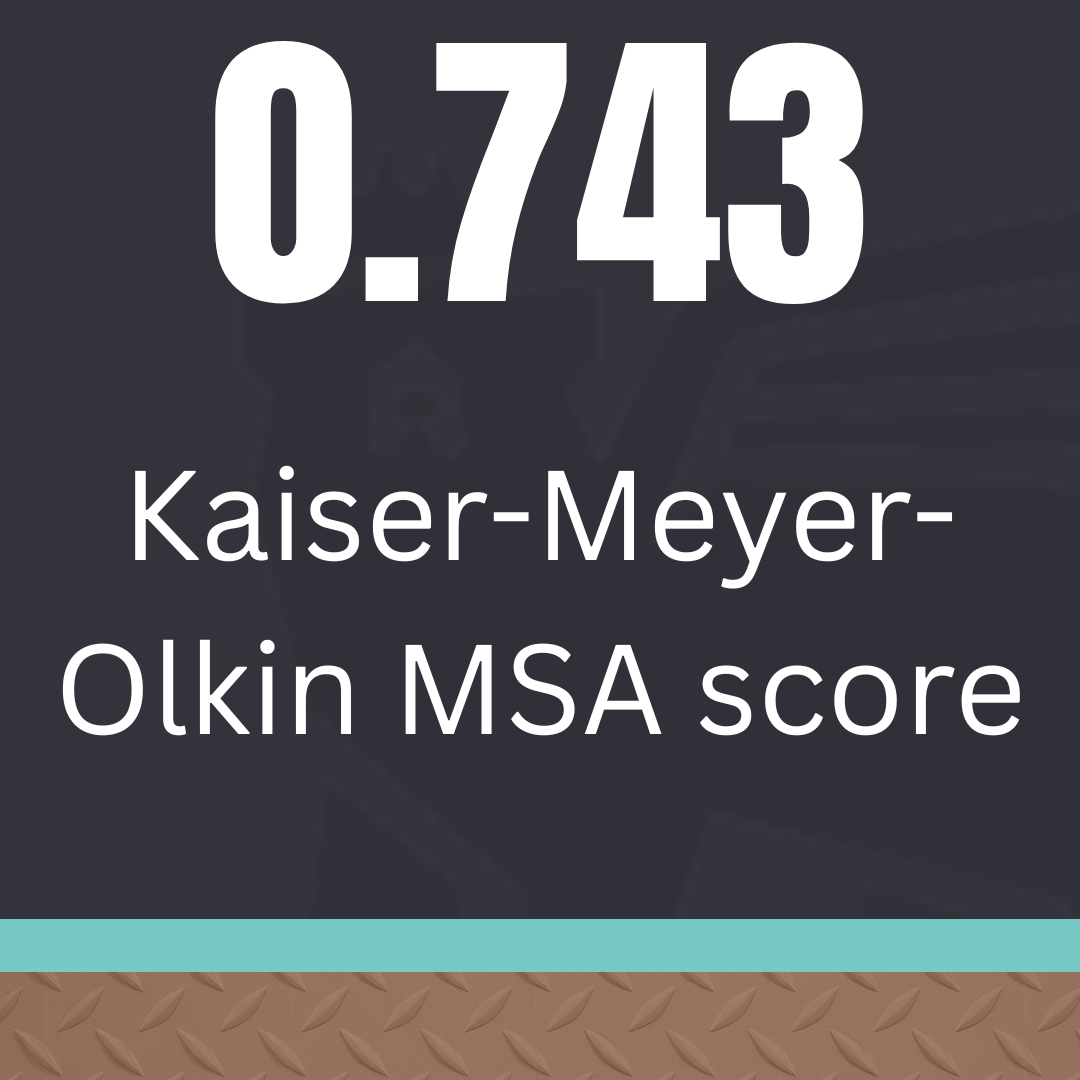
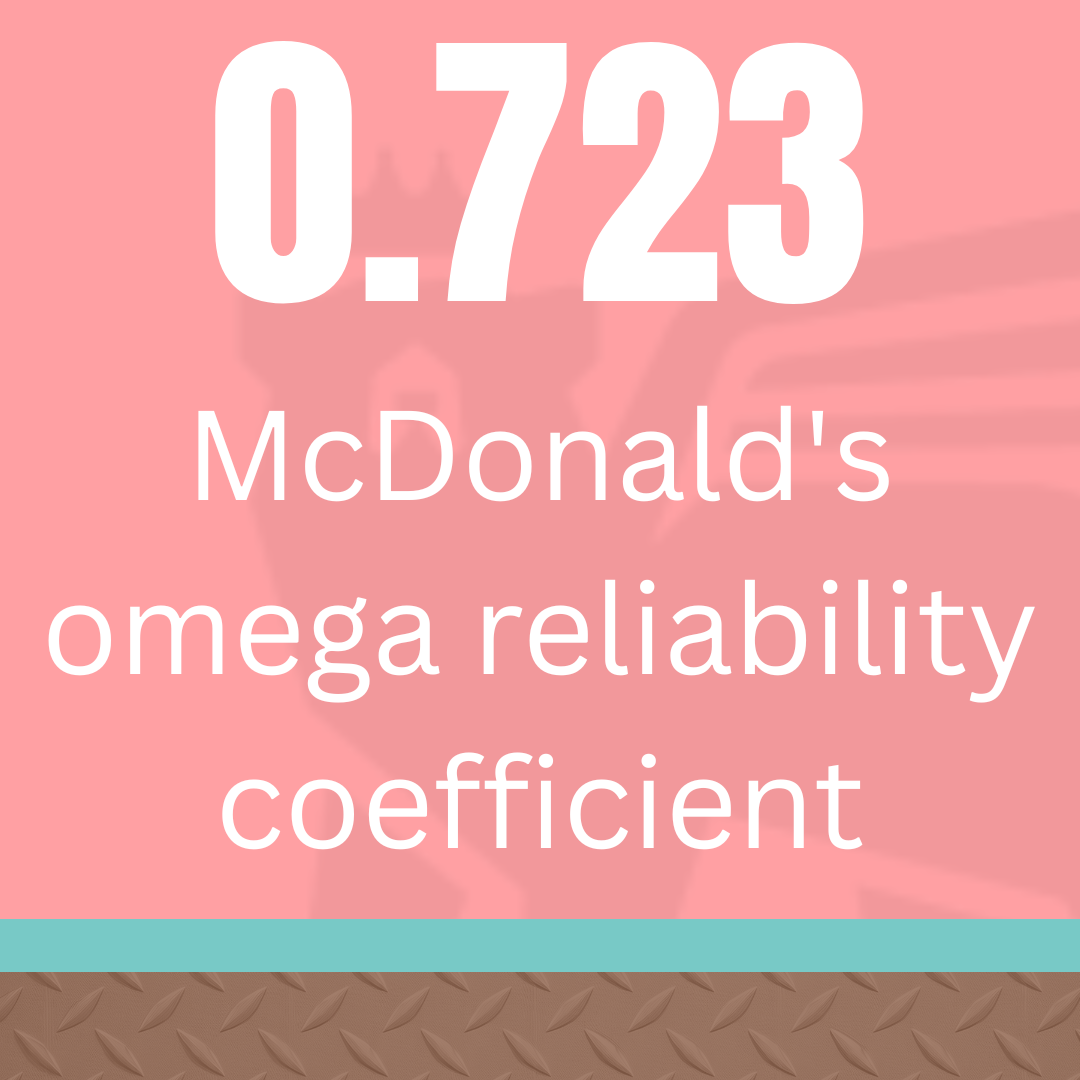
Before any further analysis was run, the dataset was tested for reliability using McDonald's omega. The coefficient returned 0.723, indicating acceptable internal consistency. The survey was measuring what it claimed to measure. The Kaiser-Meyer-Olkin test then confirmed the dataset was appropriate for factor analysis, returning an overall MSA of 0.743, above the 0.6 minimum threshold required to proceed.
With those checks confirmed, five layers of analysis were run: Pearson correlation to identify significant relationships between attributes, network analysis to map how those relationships connect, exploratory factor analysis to identify underlying consumer perception segments, linear regression to find predictors of overall satisfaction, and logistic regression to find predictors of purchase preference.
01 — RELIABILITY TESTING
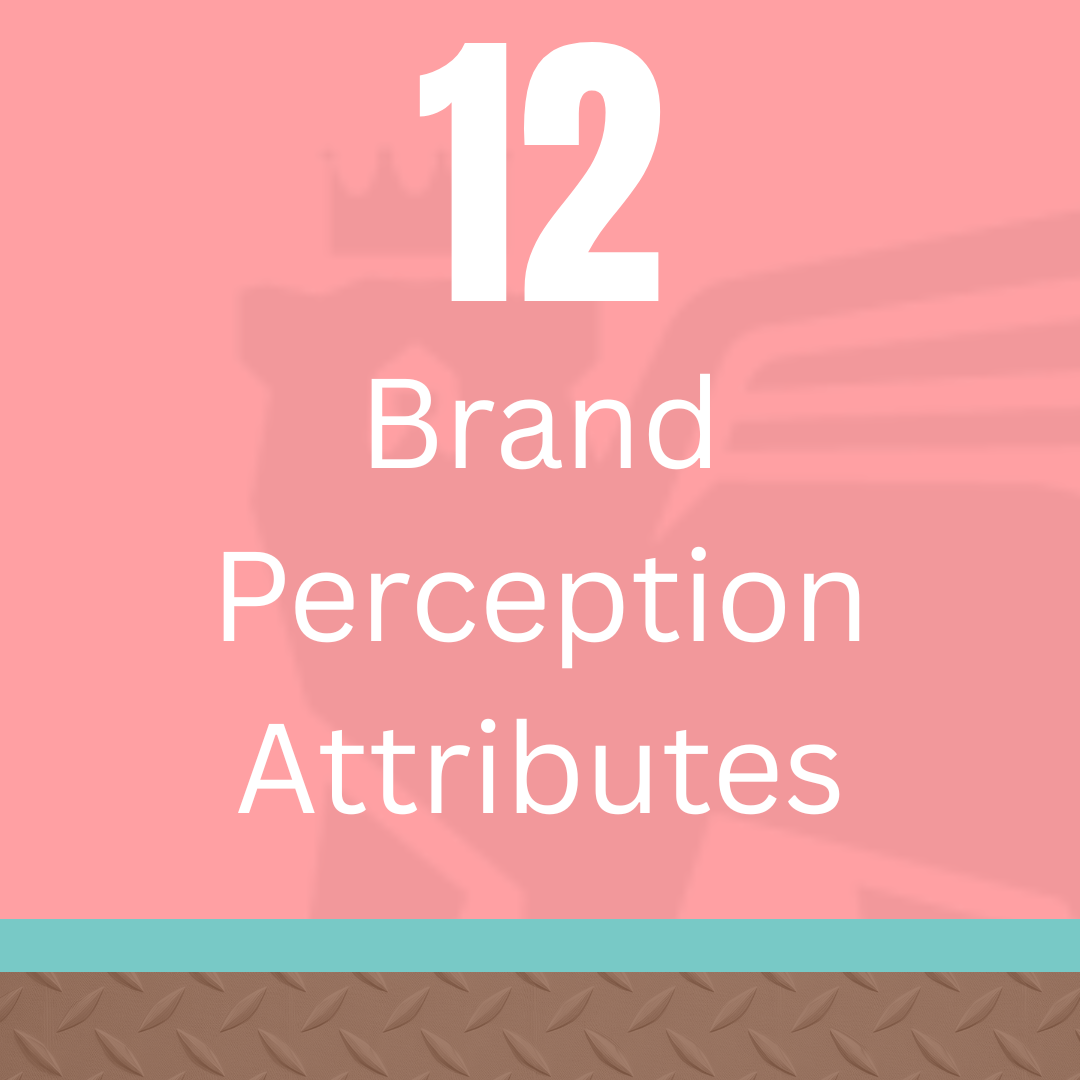
The first step before running any analysis was confirming the survey was actually measuring what it claimed to measure. McDonald's omega, a reliability coefficient, was used to test internal consistency across all 12 attributes. The coefficient returned 0.723, which falls in the acceptable range and indicates the items in the survey were consistently measuring the same underlying construct. In plain terms, the responses were reliable enough to build analysis on.
One item worth noting: ease of cleaning correlated negatively with the overall scale, suggesting it does not align as strongly with the other attributes. This becomes relevant later in the regression findings.
Pearson correlation analysis tested the relationships between all 12 brand perception attributes. Of the possible relationships tested, 39 were statistically significant at p less than 0.05. The three strongest were:
Innovation and temperature hold (r = 0.58) — the strongest relationship in the entire dataset. Consumers who believe Stanley holds temperature well are significantly more likely to see the brand as innovative. Temperature retention is not just a functional feature. It is how consumers measure the brand's technology.
Convenient to carry and satisfaction (r = 0.45) — consumers who find Stanley easy to carry report significantly higher overall satisfaction. This points directly to the role daily usability plays in how the brand is perceived.
Satisfaction and trust in the brand (r = 0.41) — consumers who are satisfied with Stanley also trust it. Trust is not built through marketing. It is built through consistent, positive daily use.
What this means for Stanley: temperature hold and portability are the two attributes most connected to how consumers feel about the brand overall. Advertising that demonstrates these two qualities in action, not as claims but as real use scenarios, will resonate most with the consumer this data describes. Trust follows satisfaction. Satisfaction follows use. The brand needs to show the product being used, not just being carried by a celebrity.
04 — EXPLORATORY FACTOR ANALYSIS
FACTOR 1: Daily Life Dependability Eigenvalue: 2.527
03 — NETWORK ANALYSIS
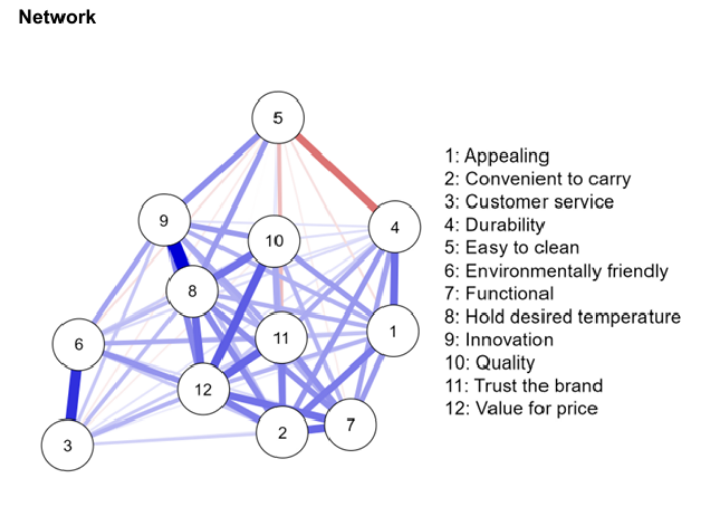
Network analysis mapped the relationships between all 12 attributes visually, showing which ones are most central to how consumers think about the brand and which ones pull in opposite directions.
Value for price emerged as the central hub node, connected most strongly to convenient to carry, satisfaction, trust the brand, quality, and temperature hold. This tells us that consumers do not evaluate price on its own. They weigh it against how well the product performs in their daily life. When Stanley meets their expectations on convenience, temperature retention, and reliability, the price feels justified. When it does not, no celebrity partnership or limited color drop changes that perception.
One negative relationship also stands out. The red line between easy to clean and durability indicates these two attributes pull in opposite directions. Consumers who rate durability highly tend to rate ease of cleaning lower, and vice versa. This suggests consumers may mentally associate a tougher, more durable product with being harder to maintain.
What this means for Stanley: Create an advertising strategy around Stanley's temperature hold capabilities and the engineering behind it to build trust and reinforce the brand's innovative identity, while simultaneously highlighting portability and convenience. Focus marketing efforts toward the everyday, active, and busy consumer who sees Stanley as reliable and convenient. Value for price is not a pricing problem. It is a performance communication problem. When consumers believe the product delivers, the price justifies itself.
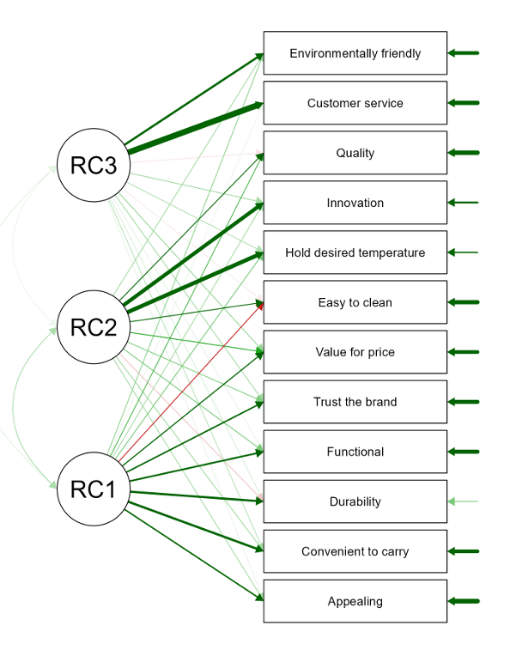
Exploratory factor analysis using varimax rotation identified the underlying structure of how consumers perceive Stanley. Rather than treating all 12 attributes as separate and equal, factor analysis groups them into clusters based on how consumers actually experience them together. Three factors emerged, each representing a distinct consumer perception segment.
Strongest factor Variables: Convenient to carry, durability, functional, trust the brand, appealing, value for price.
This is the dominant factor by a significant margin. The Stanley consumer in this segment is not primarily moved by trend or aesthetics. They are asking one question: Does this product reliably earn its place in my daily life? When the answer is yes, trust and satisfaction follow. This is the largest and most important consumer segment Stanley has.
05 — ONE-WAY ANOVA
Three Factor Cards
FACTOR 2: Product Performance Eigenvalue: 0.981
Variables: Temperature hold, innovation, quality, ease of cleaning.
Performance-driven consumers who notice engineering. They associate temperature retention with innovation. This factor is considerably weaker than Factor 1, which tells you that performance claims alone do not drive overall brand perception.
Exploratory Factor Analysis Path Diagram — Three factor model, varimax rotation.
FACTOR 3 Brand Responsibility Eigenvalue: 0.930
Weakest factor Variables: Customer service, environmental friendliness.
The weakest factor in the model. Given that environmental friendliness is also a negative predictor of satisfaction in the regression analysis, this factor points to a real tension in how Stanley communicates its values.
What this means for Stanley:
Factor 1 has a significantly larger eigenvalue than the other two factors, making it the most important driver of consumer perception. Stanley's primary advertising and communication focus should be built around showcasing the brand as a reliable, trustworthy part of a consumer's day-to-day life. This means leaning on portability, practicality, and real consumer stories rather than celebrity partnerships. Factor 2 suggests Stanley should demonstrate product performance in action, such as content showing temperature retention over time, to appeal to the detail-oriented consumer. Factor 3 indicates that while sustainability matters to some consumers, it is the weakest driver and must be framed carefully to avoid the negative associations the regression data revealed.
One-way ANOVA tested whether demographic variables produced significant differences in overall satisfaction. Five variables were tested: gender, age, race, education, and annual income.
Gender: p = 0.64 — not significant Education: p = 0.91 — not significant Race: p = 0.16 — not significant Age: p = 0.54 — not significant Annual income: p = 0.038 — significant
Annual income was the only demographic variable that produced a significant difference in satisfaction. Post hoc testing using Tukey's HSD revealed that consumers earning $100,000 to $149,999 were significantly less satisfied than those earning $50,000 to $74,999, with a Cohen's d of -0.642, a medium to large effect size.
In plain terms, higher earners are less satisfied with Stanley. They bring higher expectations to the product and the brand is not meeting them at that income tier.
What this means for Stanley:
Stanley's satisfaction problem is not defined by gender, age, race, or education. It is defined by income. The high-income consumer segment, which Stanley has been actively courting through premium collaborations and celebrity partnerships, is the least satisfied group in the data. This is an unmet expectations problem. Stanley should consider whether its premium positioning and pricing are matched by a premium product and communication experience, particularly for consumers who have the means to buy anything and are choosing to be critical.
06 — LINEAR REGRESSION
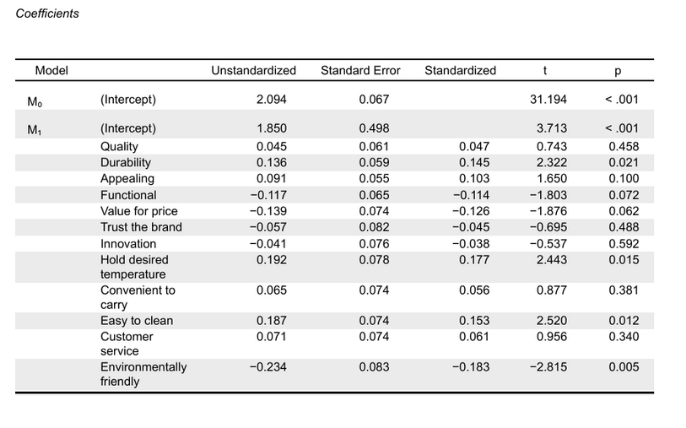
Linear regression tested which of the 12 brand perception attributes were significant predictors of overall satisfaction. The overall model was statistically significant (p less than 0.001), meaning the attributes collectively do a meaningful job of predicting how satisfied a consumer will be.
Four attributes were significant individual predictors:
Durability (t = 2.32, positive) — consumers who rate Stanley as durable report significantly higher overall satisfaction. Toughness and longevity matter.
Temperature hold (t = 2.44, positive) — consumers who believe Stanley holds their desired temperature report higher satisfaction. The product doing what it promises drives how people feel about it overall.
Ease of cleaning (t = 2.52, positive) — consumers who find Stanley easy to clean report higher satisfaction. Convenience in maintenance contributes directly to how the product fits into daily life.
Environmental friendliness (t = -2.82, negative) — this is the most surprising finding in the entire study. As a consumer's rating of Stanley's environmental friendliness goes up, their overall satisfaction goes down. Eco-claims are not building goodwill with Stanley consumers. They appear to be triggering a low-performance association.
What this means for Stanley:
Do not lead with sustainability claims. The data shows they actively hurt satisfaction with Stanley's core consumer. Instead, tie any environmental messaging directly to product performance. Stanley is made from recycled steel that outlasts plastic by decades. That is a durability argument, not an eco argument, and durability is one of the strongest positive predictors of satisfaction in this dataset. Focus core advertising on durability, temperature hold, and ease of cleaning. These are the three attributes that most reliably improve how consumers feel about the brand.
07 — LOGISTIC REGRESSION
Logistic regression tested which attributes predict whether a consumer names Stanley as their best product choice, a yes or no decision rather than a satisfaction rating. The model was significant (p less than 0.001).
Two attributes stood out as the most important predictors:
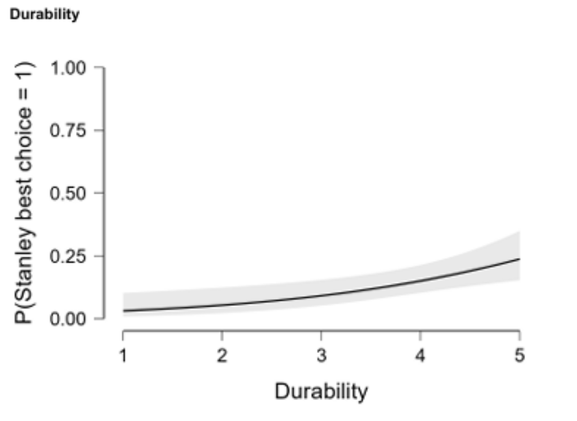
Durability (OR = 1.756, positive) — consumers who rate Stanley as durable are 76% more likely to name it as their best product choice. Durability is the single strongest driver of purchase preference in the entire model.
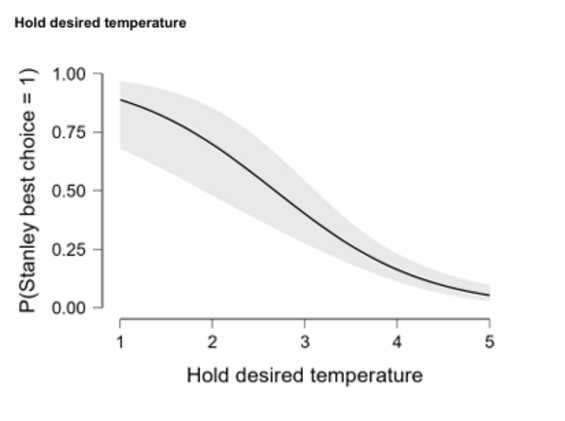
Temperature hold (OR = 0.290, negative) — consumers who rate Stanley highly on temperature hold are 71% less likely to name it as their best product choice. This is the most counterintuitive finding in the study. Consumers associate temperature hold with Stanley's innovation and brand identity, yet it does not close the sale. Durability does.
This tension between temperature hold and purchase preference is worth sitting with. Consumers use temperature hold to evaluate the brand. They use durability to choose it.
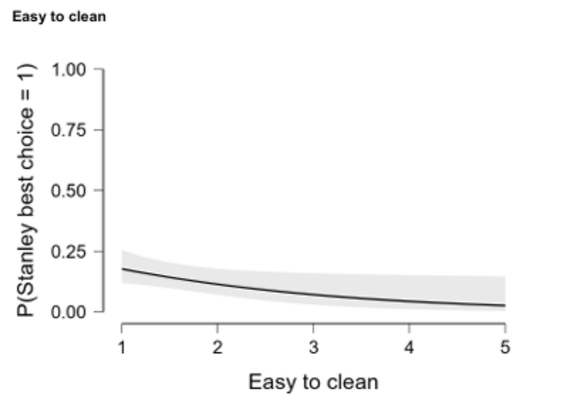
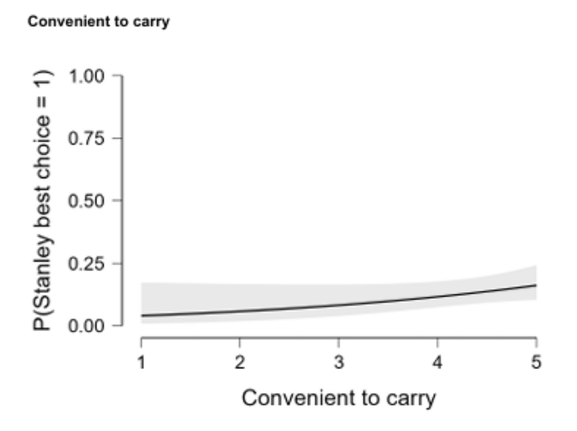
Logistic Regression Estimate Plots — Probability of naming Stanley as best product choice across key attributes.
What this means for Stanley:
Temperature hold belongs in brand-level storytelling, not in conversion-focused advertising. Use it to build the perception that Stanley is innovative and engineered beyond what competitors offer. Then use durability and convenience to close the purchase decision. These are two separate jobs that require two separate messages. Conflating them is likely why some of Stanley's current advertising feels disconnected from what actually motivates their consumer to buy.
THE INSIGHT
What the data kept returning to was not the hype buyer or the collector. It was the practical, everyday person who needs something durable, convenient, and reliable enough to earn a permanent spot in their daily routine.
OPPORTUNITY & RECOMMENDATIONS
The research consistently identified the same consumer. Practical, busy, & value-conscious. Someone who needs a product that fits into their daily life and does exactly what it promises. That consumer is not swayed by a celebrity holding a cup or a limited color drop. They are swayed by durability, convenience, and the quiet confidence that comes from a product that never lets them down. At the same time, the data revealed that Stanley is marketing itself in a way that does not fully speak to this person. Sustainability claims are hurting satisfaction. Temperature hold is being used as a conversion tool when it belongs in brand storytelling. An entire expanded product lineup is sitting largely unknown while the brand keeps selling the same Quencher identity from 2022.
RECOMMENDATION 01
Center campaign messaging on daily life dependability, not culture.
Factor 1, the dominant driver with an eigenvalue of 2.527, is built on convenience, durability, functionality, trust, appeal, and value. These are the variables that outweigh performance claims and brand responsibility in consumer perception. Advertising should show Stanley in the daily life of a practical on-the-go person, not on a shelf next to a celebrity. Consumer stories and real use scenarios will deepen the connection this segment already has with the brand.
RECOMMENDATION 02
Reframe sustainability as a performance claim, not a values claim.
Environmental friendliness is a negative predictor of satisfaction. That does not mean Stanley should abandon its sustainability positioning. It means the framing needs to change. Stanley's recycled steel outlasts plastic by decades. That is a durability argument. Lead with durability and the environmental benefit follows naturally, without triggering the low performance association consumers currently attach to eco-claims.
Use temperature hold to build brand perception, not purchase preference.
The logistic regression showed temperature hold is 71% less likely to drive best-choice preference (OR = 0.290), but the correlation data showed it is the strongest single predictor of perceived innovation (r = 0.58). Temperature hold belongs in brand level storytelling, not in conversion focused advertising. Use it to elevate how consumers see the brand's engineering. Use durability and convenience to close the sale.
RECOMMENDATION 04
Close the product awareness gap.
Stanley has expanded well beyond the Quencher into shaker bottles, wellness collections, flasks, coolers, and carry accessories. Most consumers do not know these products exist. The brand's social channels are still marketing the same tumbler identity that peaked in 2022. Advertising that introduces the full product lineup to the consumer segment identified in Factor 1, practical daily use people who already trust the brand, is the lowest cost highest return opportunity available to Stanley right now.